

Professional charts from a prompt
Every major AI chat application now has a Python engine running behind the scenes, letting you generate professional charts directly from a description.
Why chat AI can suddenly make charts
Every major AI chat application now has a Python engine running in the background, often called “code interpreter” or “advanced data analysis.” When you describe a chart, the AI writes real Python code behind the scenes, runs the calculations on your data, and executes that code. What comes out is not a painted illustration but a reproducible chart. That is exactly the difference from pure image generators: the result is exact, repeatable, and adjustable in any way you like. All you need to do is describe what you want to see.
For anyone who has so far clicked charts together laboriously in Excel, this is a real leap. Not because the AI performs magic, but because it takes the programming work off your hands, leaving you free to focus on the real question: what should the chart show?
How do you describe your data correctly?
The quality of the result depends almost entirely on how clearly you describe your data and your intent. After uploading, you explain which information sits in which columns and how it should be shown:
- What goes on the X axis, what goes on the Y axis?
- Which groupings should be highlighted?
- Do you need extra horizontal or vertical lines, say a mean value?
- Which colors fit, and are there house colors?
The more precise the description, the fewer correction rounds you need. A good prompt here is not a magic spell, just a plain work order, the kind you would give a person.
How do you refine it until the result fits?
The first draft rarely sits perfectly, and that is not a problem. Have the plot shown to you and refine it in dialogue: are the labels large enough? Does the scaling fit? Is the order of the groups right? Is something still missing? Each round of feedback brings you one step closer to the result you want. Because the AI works with real code, even fine adjustments are possible that would be cumbersome in a click-based tool.
Typical corrections in conversation include things like: “Rotate the axis labels by 45 degrees,” “Sort the bars in descending order by value,” “Make the font larger and move the legend to the top edge,” or “Also show the median as a point.” You do not need to program these changes, only name them. Often it takes two or three such rounds before a chart sits right, and because the underlying code is cleanly extended each time, nothing breaks along the way.
What is the grammar-of-graphics approach?
In Python, charts can be built in several ways. The default answers from chat tools often fall back on the base module matplotlib, yet there is a more elegant path.
Grammar of graphics is a concept described by the statistician Leland Wilkinson in his book of the same name.6 The core idea: a chart is not a finished picture but a combination of a few building blocks, namely the data, the mapping of variables to visual properties (the aesthetics), geometric objects such as points or bars, the scales, and finally the themes that govern appearance. Hadley Wickham carried this concept into the hugely successful R library ggplot2 and described it in 2010 in “A Layered Grammar of Graphics.”5
Python has a matching implementation: plotnine, developed by Hassan Kibirige.3 The syntax deliberately mirrors ggplot2, and you build the chart in layers using the + operator. The decisive advantage: presentation and data are cleanly separated. That is exactly what makes the next step so powerful.
Concretely, a chart takes shape here like a sentence built from words. First you name the data, then the mapping (which column goes on which axis, which group gets which color), then the geometry (points, bars, lines), then the scales, and finally the theme. Each layer sits visibly on top of the previous one, and each can be swapped out on its own. Want to turn a bar chart into a scatter plot? You only swap the geometry layer, everything else stays the same. In matplotlib you would often have to rewrite half the script for that. For the AI, this modular kit is ideal, because it can map your requested change to a single layer instead of regenerating the whole chart.
How do you change the look in seconds?
This is where the real gain sits, and it is often overlooked: themes. Because content and appearance are separated in the grammar-of-graphics approach, you can swap the look of a chart completely without touching the data or the chart type.
Complete themes handle this with a single line. plotnine ships ready-made themes such as theme_minimal(), theme_bw(), theme_classic(), or theme_538(); ggplot2 comes with eight built-in themes ranging from theme_grey() to theme_void().2 A single addition is enough:
This way you try out several looks in seconds and decide based on the finished image, instead of deliberating beforehand.
If you want to control individual details, the theme() function comes into play. It governs every non-data element, meaning titles, fonts, background, gridlines, and legend. It is configured through small building blocks: element_text() for fonts, element_line() for lines, element_rect() for areas, and element_blank() to remove an element entirely.2 Here is an example instruction to the AI:
The most important step for companies is the last one: a reusable theme of your own. You can define a theme() configuration once, save it under a name, and then apply it to as many charts as you like, or derive it from an existing theme.1 The result is a consistent corporate design across every chart: the same house colors, the same font, the same spacing. If the guideline changes, you adjust it in a single place, and every chart follows along. What used to be a set of charts that each looked slightly different becomes a recognizable, professional visual language.
Picture this in an everyday scenario. A department builds twelve charts for a monthly report, each made by a different person, each in slightly different colors and font sizes. The report feels disjointed, and before publication someone has to align all twelve by hand. With a shared house theme, this work disappears entirely: every chart wears the same look, and if marketing changes the house color next quarter, a single adjustment to the theme is enough. This separation of content and form is not a cosmetic detail, it saves real time on recurring reports and makes results instantly recognizable as yours.
What does a result like this look like?
The example below shows what is possible with this approach: a so-called raincloud plot, showing survey data on AI use by area of application. It combines several forms of display in a single chart, raw values as points, the distribution as an area, and figures such as the group mean as a dashed line, while staying tidy and readable. Exactly this kind of layered chart is where the grammar-of-graphics approach shows its strength.
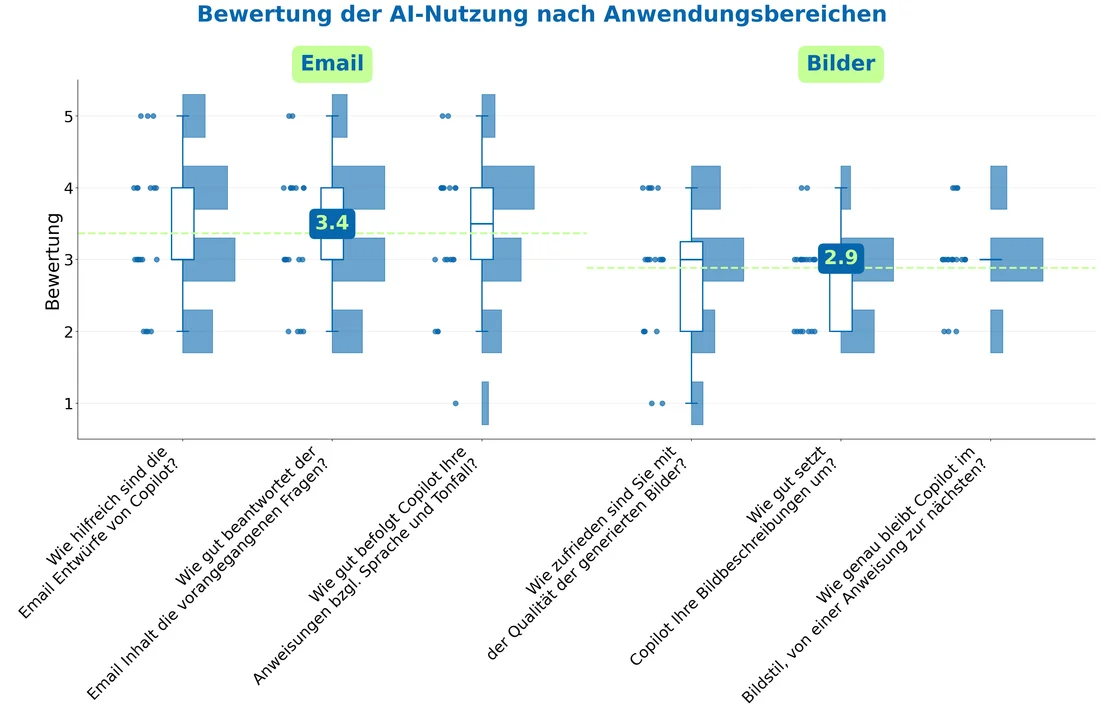
Example of a multi-layered chart generated by prompt. Created from simulated survey data.
A detailed prompt that triggers a chart like this might look something like this:
Do you need to know R or Python for this?
The short answer: no. The grammar-of-graphics approach comes from the R world, where ggplot2 has been the standard for sophisticated charts for years. That it also exists in Python, almost word for word, as plotnine is convenient, because knowledge transfers between the two languages.4 For you as a user, though, the language is secondary: you describe what you want to see, and the AI writes the code. What matters is that you name the right approach, meaning plotnine or ggplot instead of the default output, and use the correct terms for themes. That is exactly why it helps to have understood the building blocks once, even if you never write a line of code yourself.
How do you create interactive charts?
Not every chart needs to be a static image. For charts you can zoom into and interact with, you ask for plotly:
This produces charts that work especially well for presentations and dashboards, because viewers can explore the details themselves.
What to keep in mind while working
Three points turn this from a nice trick into a reliable tool:
- Privacy first. Do not upload sensitive original data to a chat application. Work with simulated data, have the finished code shown to you, and run it locally on the real data.
- Keep the code, not just the image. The real value lies in the code. Copy it so you can reproduce the chart exactly later, update it, or embed it in your own projects.
- Checking remains mandatory. AI-generated code can contain errors or wrong assumptions. Compare the result against your data before you use it further.
If you follow these three rules, a few clear sentences give you professional, brand-consistent charts, while you keep full control over data and results.
In the end, your role shifts. You no longer click charts together, you describe precisely what you want to show, choose the right approach and the matching theme, and check the result with an expert eye. The AI takes over the tedious manual work, the substantive responsibility stays with you. That is a good picture for the sensible use of AI overall: not as a replacement for your judgment, but as a fast, tireless toolbox that shortens your path to a clean result. Once you have seen a publication-ready chart emerge from three sentences, you will not want to go back to the spreadsheet.
Sources
- plotnine. A Grammar of Graphics for Python. Documentation. plotnine.org
- plotnine. Theme basics. Guide. plotnine.org/guide
- Kibirige H. plotnine (has2k1). GitHub repository. github.com/has2k1/plotnine
- Wickham H. ggplot2: Complete themes (ggtheme). Reference. ggplot2.tidyverse.org
- Wickham H. A Layered Grammar of Graphics. J Comput Graph Stat. 2010;19(1):3-28. doi:10.1198/jcgs.2009.07098. had.co.nz
- Wilkinson L. The Grammar of Graphics. 2nd ed. New York: Springer; 2005.
Professional charts from your data?
We show your team how a plain description turns into on-brand, reproducible charts.
Frequently asked questions
How do I create a professional chart with an AI chat?
Upload your data and describe which information sits in which columns and how it should be shown: what belongs on the X axis, what belongs on the Y axis, which groupings should be highlighted, and which colors fit. AI chat applications use a Python engine behind the scenes for this, which executes real code.
What is the grammar-of-graphics approach, and how do I use it in Python?
The grammar-of-graphics approach describes a chart as a combination of building blocks: data, the mapping of variables to visual properties, geometric objects, scales, and themes. In R this is implemented as ggplot2, in Python as plotnine. The matching prompt is: "Generate the chart using the ggplot approach via the plotnine module in Python."
How do I change the look of a chart quickly?
Through themes. A complete theme such as theme_minimal() or theme_bw() changes the entire appearance with a single line, without touching the data or the chart type. With the theme() function and the element_ functions, you fine-tune individual elements such as font, gridlines, or background.
How do I get a consistent look across many charts?
Define your own reusable theme with your house colors, your font, and fixed spacing, and apply it to every chart. This creates a consistent corporate design that you can change centrally in one place.
How do I get an interactive chart instead of a static image?
With the prompt "Generate an interactive chart with plotly" you get charts you can zoom into and interact with.